As Jimmy McMillan's party famously put it: the rent is too damn high. In California’s 46th Congressional District, anchored by Santa Ana, a year of the median rent—$2,232 a month, utilities included—comes to 65.5 percent of what the typical worker there earns in a year. Nationally, the same calculation yields 38 percent.
No House district in the country is more squeezed. That gap underpins Newsweek ’s new Rent Belt Index (see at the bottom of this article), which scores all 436 House seats, including Washington, D.C.’s delegate. In 182 of them, rent claims more of a typical paycheck than the national norm, and the norm is already punishing.
A record 22.7 million renter households , 49 percent of the total, spent more than 30 percent of their income on rent and utilities in 2024, according to Harvard’s Joint Center for Housing Studies. Higher rent and utility costs are eating an ever-growing portion of incomes, leaving renters with less to cover essential expenses, such as food and health care, putting greater financial pressure on households. “Cost burdens have increased in communities of all sizes, from the largest metro areas to rural areas, and in nearly every state of the country,” Whitney Airgood-Obrycki, a senior research associate at the Joint Center, told Newsweek .
“Affordability challenges are also increasingly common among middle-income renters.” Democratic socialists, emerging as a potent political force, argue that this squeeze can carry them from city halls into Congress. With the midterms just over a week away, the rent belt is where the argument meets the ballot. The left’s surest wins this year—two democratic socialists in New York—came in the belt’s middle ranks, where most households rent.
The hardest-hit districts at the top of the index are held mostly by long-serving Democrats, and two of the top five by Republicans. In 2018, Alexandria Ocasio-Cortez, a 28-year-old member of the Democratic Socialists of America (DSA), unseated 10-term Representative Joe Crowley on a platform that called housing a human right. Her district in the Bronx and Queens scores 124.2, just shy of the belt’s core, and 72 percent of its households rent.
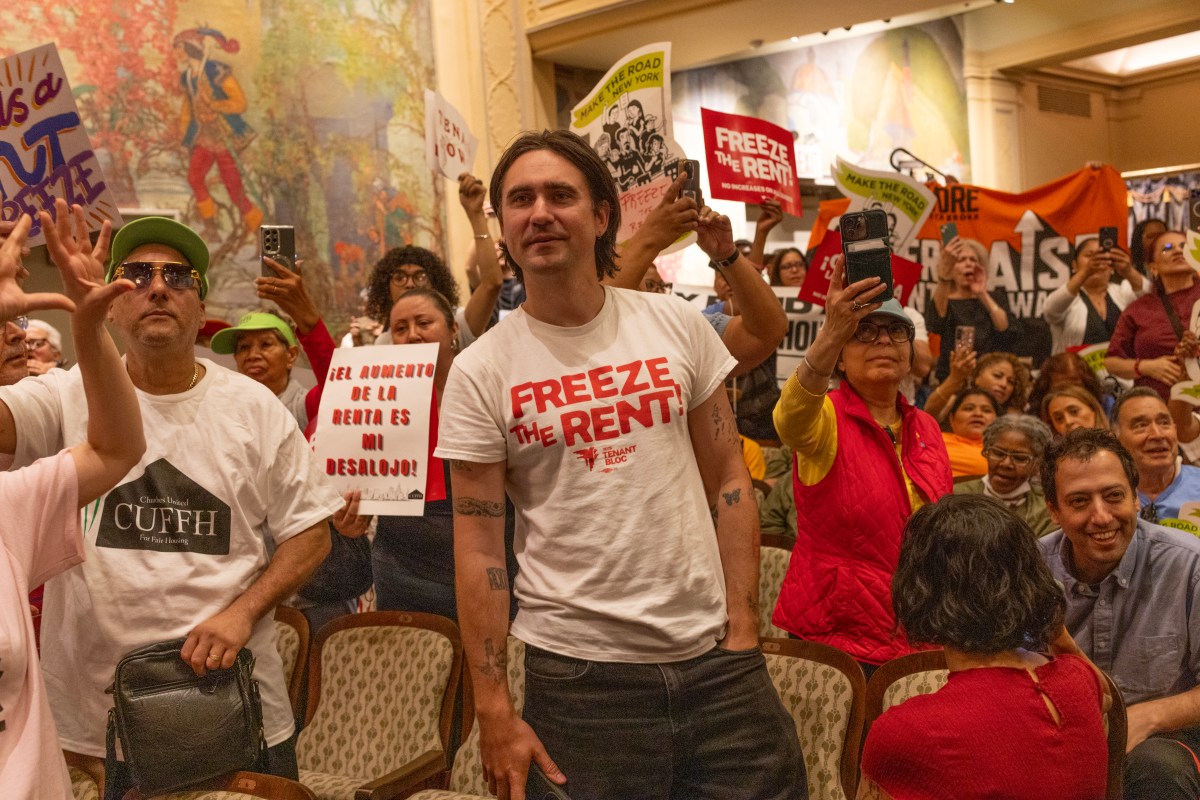
Last year, Zohran Mamdani won New York’s mayoralty promising to freeze the rent. In June, a Rent Guidelines Board on which he had appointed six of nine members voted 7-1 to do just that for about 1 million stabilized apartments. Mamdani called it “a historic victory for New York City tenants.” The Real Estate Board of New York countered that the board had “ignored its own data.” Both New York winners followed that template.
On June 23, Assembly member Claire Valdez took 56 percent in the open 7th District’s primary, and community organizer Darializa Avila Chevalier ousted five-term Representative Adriano Espaillat in the 13th, 49 percent to 46 percent. And both districts sit in the belt, at 115.2 and 114.5, and both are overwhelmingly renter: 78 percent of households in the 7th, 87 percent in the 13th. Barring an upset, both women are headed to Congress.
California is the harder test. In the East Bay’s 14th District (116.5), then-State Senator Aisha Wahab, a champion of housing affordability, won an August special election to finish Eric Swalwell’s term, despite millions from AIPAC-affiliated groups backing her rival, Melissa Hernandez, whom she faces again in November. In Sacramento’s 7th (115.5), City Council member Mai Vang, endorsed by the local DSA chapter though she calls herself a progressive Democrat, is challenging 82-year-old Representative Doris Matsui.
And in the Central Valley’s 22nd, 54th on the index at 126.1, Sanders-backed progressive Randy Villegas is trying to unseat Republican Representative David Valadao in a seat Proposition 50 redrew in Democrats’ favor. Of course, rent pain is not a one-party affair. Republicans hold more than a third of belt seats, including 14 of the 56 districts in its core.
And left challenges in the belt’s most squeezed regions have fallen flat. In California’s 29th, ranked 16th, progressive challenger Angélica María Dueñas drew 25 percent of the June vote to the incumbent’s 51 percent. In South Florida, where the index’s top districts cluster, Representative Jared Moskowitz beat a DSA-endorsed challenger with about 64 percent, declaring that voters “overwhelmingly chose the independent-minded approach.” And three of the House left’s best-known members, Ilhan Omar , Rashida Tlaib , and Summer Lee, represent districts outside the belt.
Yet the squeeze the left campaigns on is widening. Renter cost burdens are highest in Florida, Nevada, and California, with Miami, Orlando, and Las Vegas among the least affordable big metros, Harvard’s Airgood-Obrycki told Newsweek . Every district in Florida and Nevada falls inside the belt, as do 50 of California’s 52.
The center’s latest rental report found burdens rising in 44 states and 88 of the 100 largest metros over five years, increasingly among middle-income renters. Affordability, Airgood-Obrycki said, has become “a growing concern for both a wider range of communities and a broader constituency.” That makes November a decent test of how tightly this issue is gripping electoral politics, and how deeply into the map it penetrates. The constituency of aggrieved renters is growing.
More and more people find themselves priced out of buying a home. Mortgage costs are high too, and, ironically, expensive rents also prevent people from saving. The number of cost-burdened renter households has grown by 2.3 million since 2019 , and the homeownership rate has fallen for two straight years, with the typical home now selling for nearly five times the median household income.
Mortgage rates are back above 7 percent . And the rent itself leaves little room to save: lower-income renters had a median of just $210 a month left after housing costs in 2024. Democratic socialists and progressives , inspired by Mamdani's success, see everything to play for.
How the Rent Belt Index Works Newsweek divides a year of each district’s median gross rent (rent plus utilities) by the median annual earnings of its workers, using 2024 Census Bureau survey data, and sets the national figure at 100. A score of 125 means rent takes a quarter more of a typical paycheck than it does nationally. Districts above 100 are in the belt; those at 125 or higher, with a lead clear of the survey’s margin of error, form its core.
Scores use current district lines; nine states, including California and Florida, vote on redrawn maps this year. To use the tool, search by state, district, or representative, or tap any bar in the chart; a ZIP code link helps if you don’t know your district. Each card shows the district’s score, ranks, rent and earnings, and who is on the November ballot.
The full table can be sorted, filtered, and downloaded. The Rent Belt Index | Newsweek Midterms 2026 The Rent Belt Index In these districts, rent swallows more of a typical worker’s pay than it does nationally. Look up yours, see where it ranks, and see who is on the ballot on Nov. 3.
Find your district Every district, ranked Each bar is one House district, sorted from the biggest rent squeeze to the smallest. The dashed line is the national level. Hover or tap a bar to see the district.
The data Show State How the Rent Belt Index works
Source: Newsweek